This year’s “Top 100 Container Ports” annual edition again surveys the world’s largest box ports. While some of the results are as expected — Shanghai is still world’s largest container port — there are a number of up and coming ports that reflect new trends in the container trades.
Rank and File:
This year’s annual edition of AJOT’s Top 100 Container Ports A-Z holds a few surprises, but for the most part reflects industry trends that have been decades in the making. It surprises no one that nine of the top ten in the 100 ports’ list are Asian. Or that China has seven ports in the top ten, led by Shanghai with a throughput of over 47 million TEUs. Maybe the only surprise in Shanghai’s numbers is that they haven’t become the first 50 million TEU port…the COVID lockdowns had something to do with that but 50 million TEUs is coming. Of course, China’s ports are nearly all growing, and it is difficult to think that one country boasts six ports with a throughput of over 20 million TEUs. With only Hong Kong at 16.5 million TEUs continuing to slide down the port ranks — a function of the expansion of nearby ports like Shenzhen, (4) at over 30 million TEUs and Guangzhou (6) at 24.6 million TEUs. And Ningbo-Zhoushan (3) handling over 33 million TEUs has become a rival to Shanghai – the alternative mega-port (if any port handling 30 million TEUs can be called an “alternative”) to Shanghai’s sprawling port system.
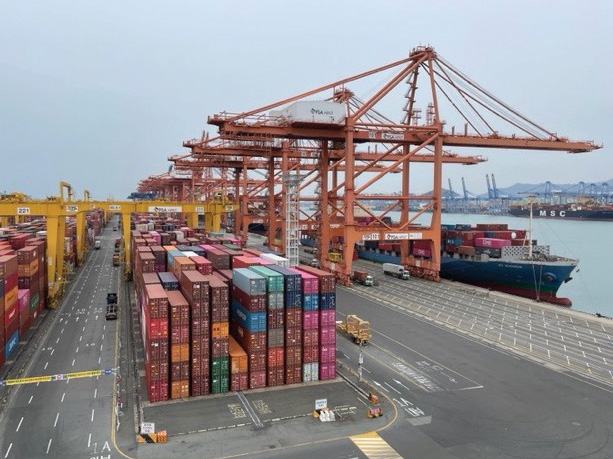
In terms of the North Asia cargo basin, the only non-Chinese port in the mix is the South Korean container port of Busan (7) handling 23.5 million TEUs.
Historically, the Japanese ports of Kobe (65), Tokyo (45) and Yokohama (68) would have been at the top or near the top when it comes to North Asia. But as the rankings suggest that is no longer the case. In the 1990 edition of the “Containerisation International” (CI) Yearbook, Yokohama ranked 11th, Tokyo 13th and Kobe 3rd… and Shanghai wasn’t to be found in the top 20 ports. A great economic swing changed all that.
Although 10 million TEUs back from the top slot is a large margin for a container port, [consider that Los Angeles (16) largest port in the United States fell below the 10 million TEU threshold in 2022] but it can be argued that even at number two, Singapore is the world’s most important port. Singapore with over 37 million TEUs is Southeast Asia’s largest port. But with the mega-terminal of Tuas still in Phase 1 of four phases, the numbers of this port are only going to rise. And when it comes to strategic location, Singapore has it all with the Straits of Malacca and its position to the emerging North-South trade lanes. It is hard to imagine the chaos that would ensue in the world’s supply chains should Singapore be unable to function.
Interestingly, neighboring Malaysia now has two mega-ports: Port Klang at number 12 and Tanjung Pelepas in the 15 slot, both tallying over 10 million TEUs, [for more details see 10 Million TEU Club chart]. Of course, intra-Southeast Asia trade is booming as manufacturing shifts out of China into Vietnam, Thailand, and Malaysia. The caveat to that boom is that while China trade was down in 2022 and nearly all the region’s ports have been impacted to some degree —we are now seeing signs of recovery in intra-Asia trade with China. The manufacturing shift to Southeast Asia has sparked a region-wide port boom to handle the export growth.
Almost as a side note, so important is the Southeast trade flow that AlphaLiner recently published an article on Bangkokmax or maxi-Bangkok, for smaller size feeder vessels that could traverse the Chao Phraya River up to the Port of Bangkok. Of course, because of the river restrictions, the Port of Laem Chabang (20) was built and now handles 8.7 million TEUs.
Southeast Asia is now home to a number of 4-6 million TEU ports, such as Manila (33), Cat Lai [Ho Chi Minh City] (32) and Tanjung Perak (49) Indonesia, many of which have building projects in the works. This is particularly true in Vietnam, which has port projects both in the North and South to boost capacity to keep up with the plethora of new factories churning out products. The freight transiting Ho Chi Minh City’s Cat Lai at 5.5 million is already near the designed capacity of 6.4 million. So, now there is a proposal on the table to build a new mega-port at Can Gio with a capacity of 10-15 million TEUs.
European Ports Endure Headwinds
The headwinds of the region’s faltering economic growth — with Germany in a near recession — terminal congestion and the ongoing fallout from the Ukraine-Russia War and the tension between the West and China not to mention lockdowns and service disruptions in the PRC, and the adjustment to the BREXIT actuality, have all contributed to a region wide slowdown in 2022. Theo Notteboom, a noted chronicler of European ports wrote, “2022 brought a relatively strong traffic decline in most top 15 ports, with only Gioia Tauro and Marseille showing a growth above 2%. The top 15 ports combined handled 4.2% less compared to 2021 and 3.2% less than in 2019.”
Rotterdam (10) remains a premier European hub with nearly 14.5 million TEUs. But the recently combined port of Antwerp-Bruges (13) isn’t far behind at 13.5 million TEUs. Hamburg ranks number three in Europe and number 21 overall at 8.25 million TEUs. Valencia (34) leads the Southern European ports at just over 5 million TEUs with Piraeus (39) just under 5 million TEUs. Algeciras (40) and Bremerhaven (41) posted 4.76 million and 4.6 million TEUs respectively. Gioia Tauro (56) handled around 3.4 million TEUs while Marsaxlokk (Malta) ranked 67th had a throughput of 3.4 million TEUs.
Although technically in North Africa, the Moroccan port of Tanger-Med (23) which handled almost 7.6 million TEUs in 2022, has proven to be a remarkable success as a Mediterranean Sea hub port. It joins Valencia, Gioia Tauro, Piraeus, Marsaxlokk (Malta), and Algeciras on the list of hub ports in the Mediterranean. But Tanger-Med is both the newest and now the largest of the region’s transshipment hubs – anchoring trade lanes moving in and out of the eastern Med. The importance of the Mediterranean hub ports is growing as the shift in trade from China to Southeast Asia and South Asia to not only Europe but North America, has increased the importance of the Suez Canal transit.
North American Ports
In the world rankings, Los Angeles is 16th, just under 10 million TEUs with the Port of New York/New Jersey right behind holding the 17th slot at 9.5 million TEUs. In 2022 PANYNJ overtook Long Beach (19th) at 9.1 million TEUs, as the second largest U.S. container port and is gaining on Los Angeles. Will New York/New Jersey again take the top slot in North America in 2023? There is a pretty good chance it will happen with the shift to the East Coast and Gulf Coast ports away from the West Coast — if not in 2023, very soon. Although the West Coast labor dispute between the International Longshore and Warehouse Union (ILWU) and Pacific Maritime Association (PMA) is seemingly settled at this writing, a shift eastward is already underway as stakeholders in the supply chain have made more financial commitments to new facilities in the East, as have the shippers’ themselves.
Savannah at number 29 has been a big recipient of that shift as it posted nearly 6 million TEUs. And Houston (48) has become the Gulf’s hub port handling 4 million TEUs. The Port of Virginia at 3.7 million TEUs comes in at number 51 and is another recipient of the eastward movement of freight. The same can be said for the Port of Charleston ranked 70 with 2.8 million TEUs. The Port of Jacksonville at 97 with 1.3 million TEUs and Miami at 99 with 1.2 million TEUs are also big beneficiaries of not only the trend to the East Coast but of the trade with Latin America. Out of the West Coast there are still a number of ports high in the rankings besides the obvious San Pedro duo. Vancouver (Canada) at number 52 tallying 3.6 million TEUs, the Northwest Seaport Alliance (Tacoma and Seattle) at number 58 with 3.4 million TEUs and Oakland at number 74 with 2.3 million TEUs are still very important box ports.
Perhaps one of the most interesting ports on the list is Montreal at #89 handling 1.7 million TEUs. The port on the St. Lawrence River is 460 miles from the Atlantic and continues to prove that when the location is good, the business will find a way to the port.
Final note. Although much care has been taken in putting together this list. In some cases, the lack of consistent or accurate reporting has resulted in a port being dropped out that otherwise would have been included.
Nation data-cell="Rank">11
| Rank | Port | Nation | 2022 TEUs |
|---|---|---|---|
| 1 | Shanghai | China | 47,300,000 |
| 2 | Singapore | Singapore | 37,300,000 |
| 3 | Ningbo-Zhoushan | China | 33,350,000 |
| 4 | Shenzhen (1) | China | 30,040,000 |
| 5 | Qingdao | China | 25,670,000 |
| 6 | Guangzhou (2) | China | 24,600,000 |
| 7 | Busan | Korea | 23,500,000 |
| 8 | Tianjin | China | 20,120,000 |
| 9 | Hong Kong | China/SAR | 16,570,000 |
| 10 | Rotterdam | Netherlands | 14,455,000 |
| 11 | Dubai (Port of Jebel Ali) | UAE | 14,000,000 |
| 12 | Port Kelang | Malaysia | 13,740,000 |
| 13 | Antwerp-Bruges (3) | Belgium | 13,500,000 |
| 14 | Xiamen | China | 12,430,000 |
| 15 | Tanjung Pelepas | Malaysia | 10,500,000 |
| 16 | Los Angeles | USA | 9,911,156 |
| 17 | New York/New Jersey | USA | 9,493,664 |
| 18 | Kaohsiung | China/Taiwan | 9,490,000 |
| 19 | Long Beach | USA | 9,133,657 |
| 20 | Laem Chabang | Thailand | 8,740,000 |
| 21 | Hamburg | Germany | 8,256,300 |
| 22 | Suzhou (Taicang) | China | 8,000,000 |
| 23 | Tanger Med | Morocco | 7,596,845 |
| 24 | Beibu Gulf | China | 7,020,000 |
| 25 | Colombo | Sri Lanka | 6,860,000 |
| 26 | Mundra (Adani Port) | India | 6,600,000 |
| 27 | Tanjung Priok (Jakarta) | Indonesia | 6,417,053 |
| 28 | Jawaharlal Nehru | India | 6,050,000 |
| 29 | Savannah | USA | 5,892,131 |
| 30 | Rizhao | China | 5,800,000 |
| 31 | Lianyungang | China | 5,570,000 |
| 32 | Ho Chi Minh City (Cat Lai) | Vietnam | 5,500,000 |
| 33 | Manila | Philippines | 5,474,483 |
| 34 | Valencia | Spain | 5,052,272 |
| 35 | Cai Mep-Thi Vai | Vietnam | 5,000,000 |
| 36 | Jeddah | Saudi Arabia | 5,000,000 |
| 37 | Santos | Brazil | 5,000,000 |
| 38 | Yingkou | China | 5,000,000 |
| 39 | Piraeus | Greece | 4,939,983 |
| 40 | Algeciras | Spain | 4,762,808 |
| 41 | Bremen/Bremerhaven | Germany | 4,614,000 |
| 42 | Salalah | Oman | 4,503,837 |
| 43 | Dalian | China | 4,460,000 |
| 44 | Khalifa | Abu Dhabi | 4,330,000 |
| 45 | Tokyo | Japan | 4,300,000 |
| 46 | Colon (4) | Panama | 4,100,000 |
| 47 | Durban | South Africa | 4,000,000 |
| 48 | Houston | USA | 3,974,901 |
| 49 | Tanjung Perak | Indonesia | 3,800,000 |
| 50 | Felixstowe | UK | 3,700,000 |
| 51 | Virginia/Norfolk | USA | 3,695,156 |
| 52 | Vancouver | Canada | 3,600,000 |
| 53 | Barcelona | Spain | 3,522,944 |
| 54 | Cartagena | Colombia | 3,500,000 |
| 55 | Fuzhou | China | 3,450,000 |
| 56 | Gioia Tauro | Italy | 3,400,000 |
| 57 | Manzanillo | Mexico | 3,400,000 |
| 58 | NW Seaport Alliance | USA | 3,384,018 |
| 59 | Melbourne | Australia | 3,230,000 |
| 60 | Incheon | Korea | 3,174,000 |
| 61 | Chittagong | Bangladesh | 3,133,020 |
| 62 | Nanjing | China | NA |
| 63 | Le Havre (Haropa) | France | 3,100,000 |
| 64 | King Abdullah Port | Saudi Arabia | 2,910,000 |
| 65 | Kobe | Japan | 2,890,000 |
| 66 | Marsaxlokk (Malta) | Malta | 2,888,685 |
| 67 | Ambarli | Turkey | 2,867,215 |
| 68 | Yokohama | Japan | 2,800,000 |
| 69 | Genoa | Italy | 2,799,123 |
| 70 | Charleston | USA | 2,792,313 |
| 71 | Nagoya | Japan | 2,680,000 |
| 72 | Guayaquil | Ecuador | 2,400,000 |
| 73 | Callao | Peru | NA |
| 74 | Oakland | USA | 2,337,607 |
| 75 | Bandar Abbas-Shahid Raja (5) | Iran | 2,160,000 |
| 76 | Balboa (6) | Panama | 2,100,000 |
| 77 | Sydney (Botany) | Australia | 2,077,442 |
| 78 | Gdansk | Poland | 2,072,000 |
| 79 | Kocaeli | Turkey | 2,059,310 |
| 80 | London | UK | 2,050,000 |
| 81 | Dammam | Saudi Arabia | 2,038,787 |
| 82 | Kingston | Jamaica | 2,000,000 |
| 83 | Yeosu Gwangyang | Korea | 2,000,000 |
| 84 | Mersin | Turkey | 1,989,585 |
| 85 | Osaka | Japan | 1,843,000 |
| 86 | Southampton | UK | 1,800,000 |
| 87 | Tekirdag | Turkey | 1,773,228 |
| 88 | Lazaro Cardenas | Mexico | 1,700,000 |
| 89 | Montreal | Canada | 1,700,000 |
| 90 | Sines | Portugal | 1,663,000 |
| 91 | Keelung | China/Taiwan | 1,610,000 |
| 92 | Taipei | China/Taiwan | 1,600,000 |
| 93 | Yangpu (Hainan) | China | 1,546,000 |
| 94 | Marseilles-Fos | France | 1,530,000 |
| 95 | San Juan | Puerto Rico | 1,500,000 |
| 96 | Aliaga | Turkey | 1,493,841 |
| 97 | Jacksonville | USA | 1,298,132 |
| 98 | La Spezia | Italy | 1,262,496 |
| 99 | Miami | USA | 1,197,644 |
| 100 | Chennai-Kamarajar | India | NA |


